Make sharper investment decisions with institutional-grade research
You've got RSUs, a few high-conviction bets, and a nagging sense you're missing what a real analyst would catch. Dawo does the institutional work — valuation, accounting red flags, the downside — on everything you own or research, in plain English. You still make the call.
Free during beta · then Pro $19/mo, free tier stays · Read-only broker access · Not financial advice
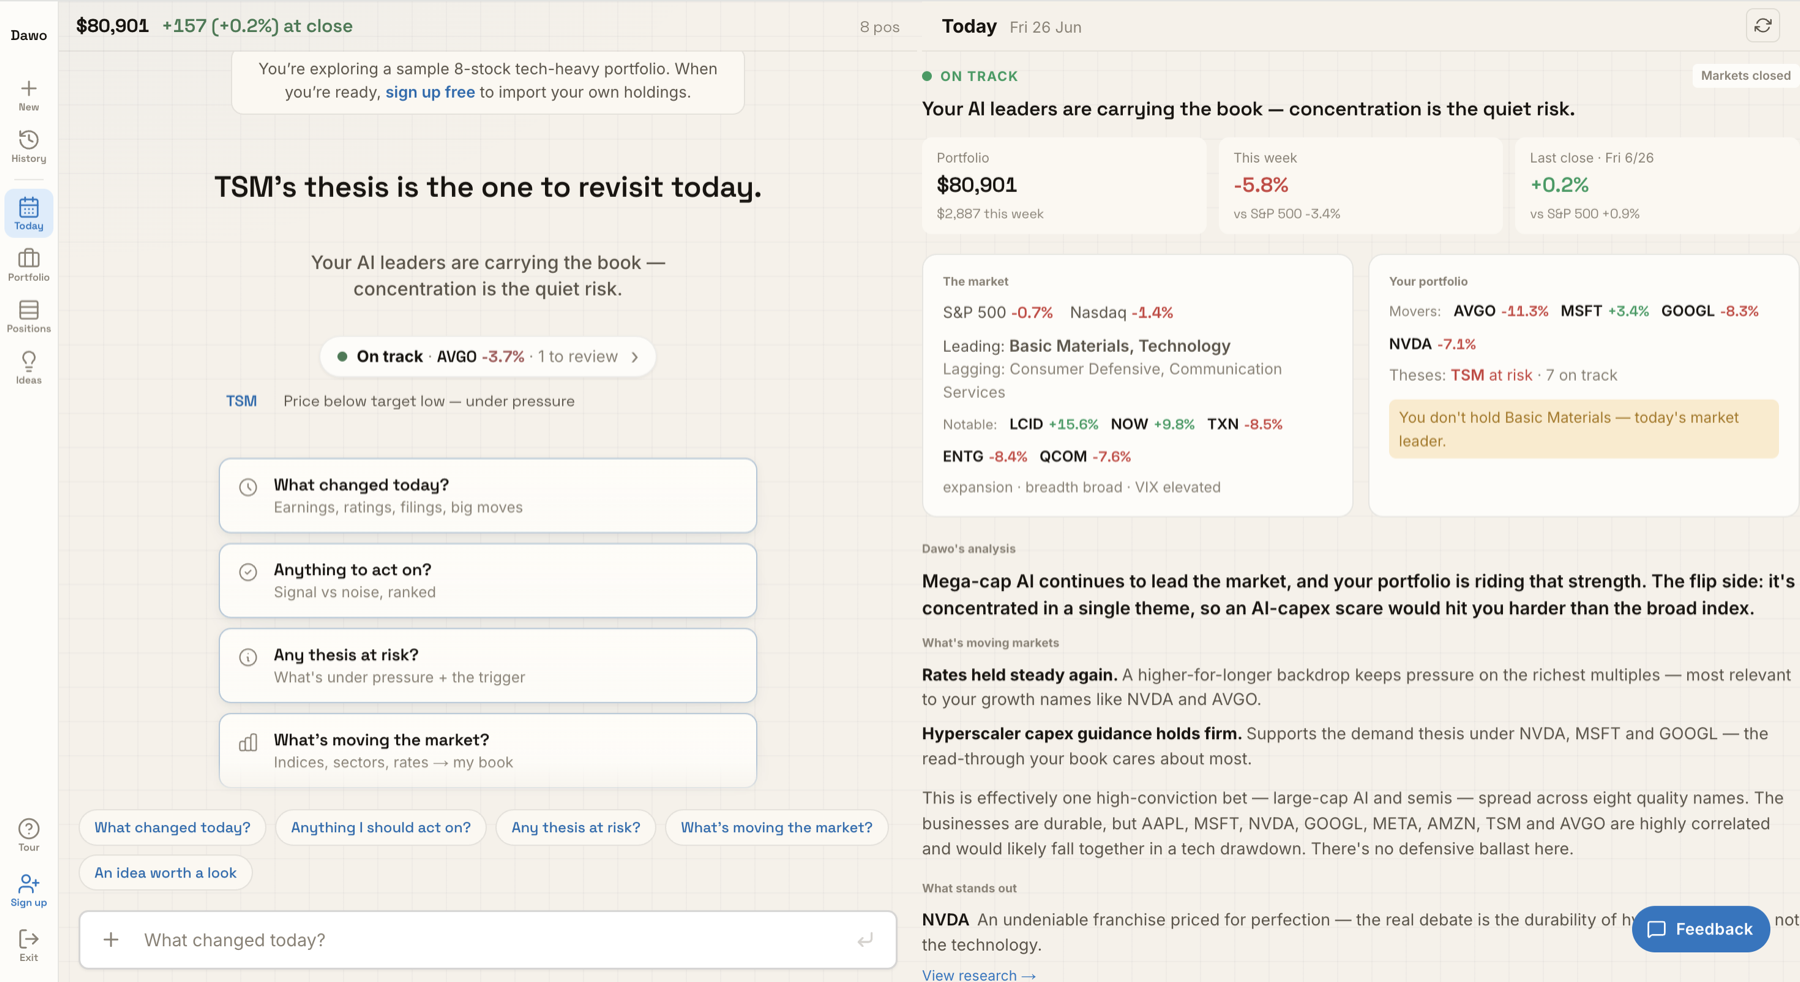
A quick tour of the live product. Illustrative — not a recommendation.
How it works
Who it's for: self-directed investors who pick their own stocks, hold for months or years, and want the analysis behind a verdict — not day traders, options speculators, or index-only investors.
One stock, end to end — then ask anything.
Point Dawo at any ticker for the full read — verdict, conviction, a fair-value range, accounting checks, and Wall Street's consensus. Then ask follow-ups in plain English and get a plan, the work, and a conclusion — every number from a real tool run you can open.
Illustrative example (figures for demonstration, not a live call). Probability-weighted expected price implies meaningful upside vs current; an installed-base + services flywheel underpins multi-year visibility, with clean forensics (Piotroski 8/9) and durable margins. Key risk: hardware-cycle dependence.
- ✓ Pulled the latest filing + guidance
- ✓ Built a DCF and back-solved the market's implied growth
- ✓ Checked valuation vs peers and stress-tested the bear case
Every term is shown the way Dawo shows it. Illustrative figures here — not a live call or advice. Run Dawo live on any ticker.
Already invested? See your portfolio the way a risk desk would.
Connect your brokerage read-only or upload a CSV. Dawo scores six health dimensions and stress-tests your holdings against real market scenarios.
| Scenario | Impact | Dollar loss | vs S&P |
|---|---|---|---|
| Market crash | -26.4% | -$13,200 | Better |
| Tech crash | -31.2% | -$15,600 | Worse |
| Rate spike | -8.1% | -$4,050 | Better |
| Recession | -18.7% | -$9,350 | Similar |
Illustrative $50k portfolio. Your analysis runs on your actual holdings with live data.
Your morning brief, written for you.
Every morning Dawo reads your holdings and the day's filings, ratings, and moves — then writes what changed, what it means, and which theses to revisit.
Risk appetite is back and your largest names are riding it — but the book is essentially one bet on large-cap tech, so a sector wobble would hit you harder than the index.
AAPL Earnings beat validates the demand thesis; durability, not direction, is the real debate.
NVDA Priced for perfection at ~2× the sector median — multiple compression is the risk.
Illustrative brief — yours is written from your actual holdings.
Why trust a verdict from Dawo?
Dawo records every verdict and measures it against what the stock actually did at 3, 6, and 12 months, using thresholds we publish. We're in beta, so the track record is still building — but the methodology is public and the live numbers are one click away. A general chatbot can't show you this, because it never kept score.
See our methodology →Isn't this just ChatGPT for stocks?
No. A general model summarizes what it read. Dawo runs the analysis.
The difference between a friend who reads the news and an analyst who runs the numbers.
Frequently asked questions
See what your portfolio looks like under the hood.
No signup, no credit card — the demo loads a sample portfolio you can poke at.