Nvidia at $5 Trillion: A Valuation Decomposition
The first time I tried to value Nvidia, in mid-2023, I anchored on the wrong question. I asked “is this expensive?”, which is the question almost every retail commentary asks, and got the predictable answer: yes, very. The forward multiple was 50x, peers were trading at 22x, and the easy frame was “this is the next Cisco.”
That frame was wrong, and being wrong about it for the last two years has been instructive. The right question, then and now, is not whether Nvidia is expensive against a static comp set. It is whether the cash flow trajectory implied by the current price is achievable, and what would have to be true at the margin, on growth durability, on margin compression, on competitive substitution, for the implied trajectory to be reasonable.
This is a decomposition, not a recommendation. I hold a position. I have been wrong about Nvidia before. Reasonable people read the same data and arrive at different conclusions.
The numbers below are as of June 2026. The live valuation, current price, updated scenario probabilities, and the underlying SEC filings and consensus data, is at dawo.ai/symbol/NVDA. If you want to override my assumptions and see how the fair value moves, the interactive sliders are there.
Where the current price implies the company is going
At $208, Nvidia trades at a market cap of roughly $5 trillion. Trailing twelve-month revenue is $215.9 billion (88% two-year CAGR), EBITDA margin is 60.4%, ROIC is in the high-60s, and free cash flow is $96.7 billion against a net cash balance sheet.
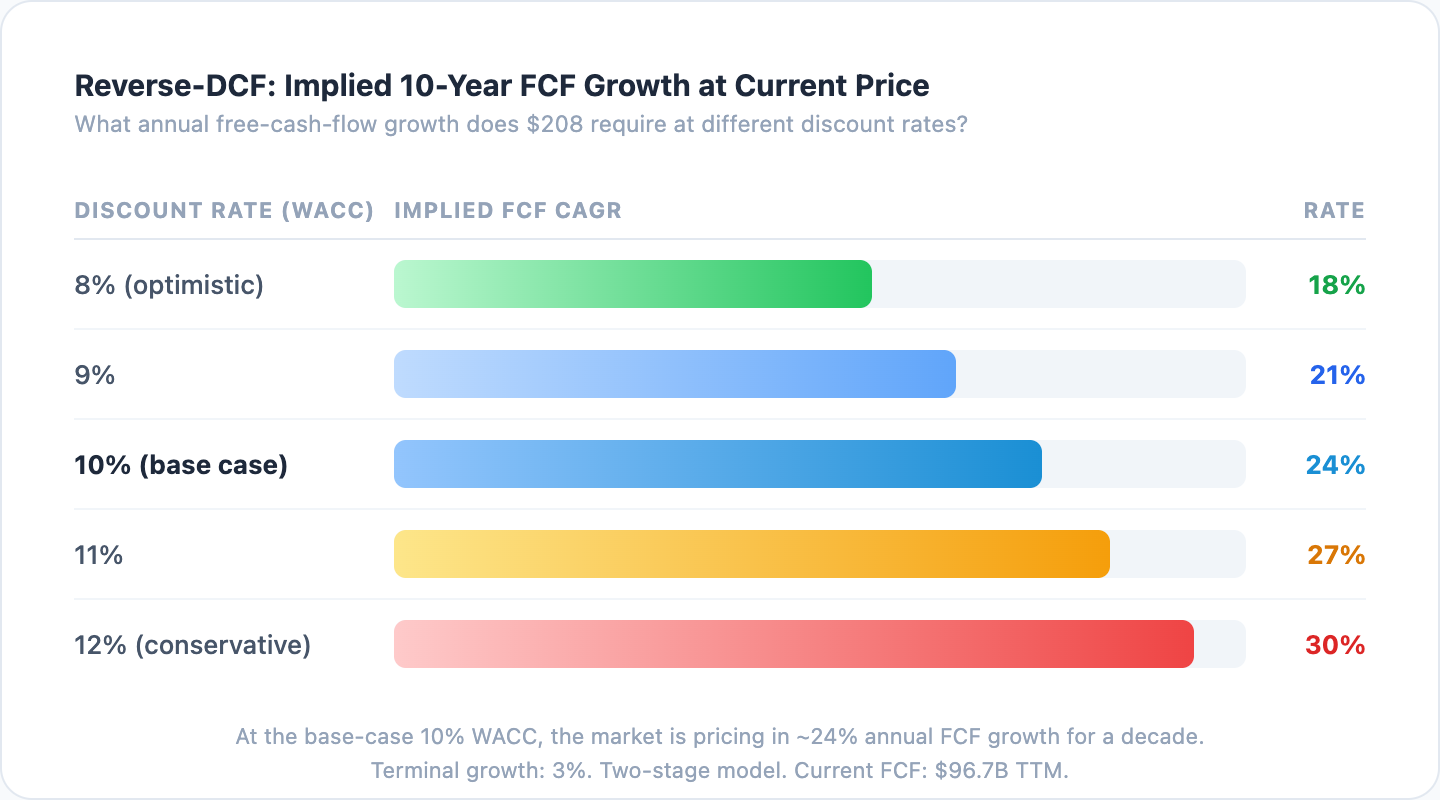
Reverse-DCF tells you the most useful thing for setting baseline expectations. At the current price, a two-stage model with a 10% discount rate and a 3% terminal growth rate implies the company needs to grow free cash flow at roughly 24% annually for the next decade, then settle into 3% perpetual growth. That requires data center revenue to roughly triple from here over ten years while preserving the bulk of current margins.
That is a serious assumption to underwrite. It is not, however, an impossible one. Companies like Microsoft (2010–2020) and Apple (2007–2017) achieved comparable cash flow expansions over similar periods, and Nvidia’s current position, pricing power, gross margins, customer concentration in the largest, fastest-growing customers in the economy, is meaningfully better than either of those at the equivalent point.
The question is whether the assumption holds given the specific structural risks Nvidia faces, which are different from the structural risks Microsoft or Apple faced. That is the entire analytical question.
The base case
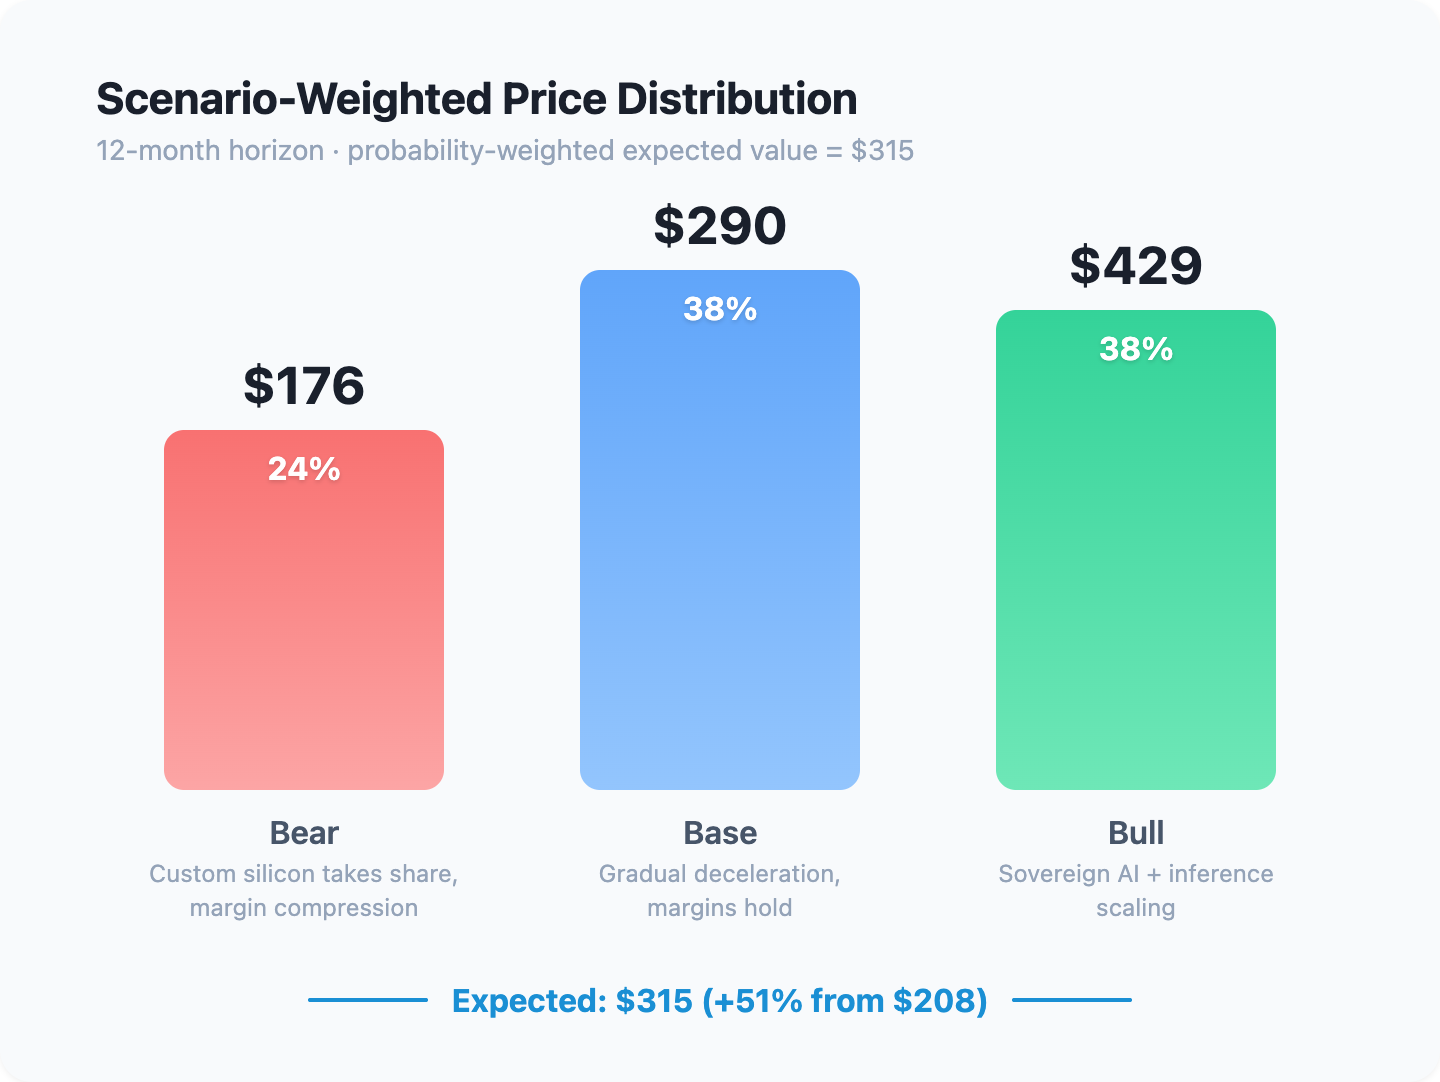
I land on a probability-weighted expected value of $315, with the distribution decomposed roughly as:
| Scenario | Target | Probability | Implied return from $208 |
|---|---|---|---|
| Bear | $176 | 24% | -15% |
| Base | $290 | 38% | +39% |
| Bull | $429 | 38% | +106% |
| Probability-weighted expected | $315 | +51% |
The math: $176 × 0.24 + $290 × 0.38 + $429 × 0.38 = $315.
The scenarios themselves:
Bear ($176). Custom silicon captures above 25% of inference workloads by 2028 (from ~10% today), data center growth decelerates below 25%, and US export rulings effectively close $15–30B of Chinese addressable revenue. EBITDA margin compresses 300–500bps as customer concentration forces price concessions.
Base ($290). Inference scaling continues to absorb training capex declines roughly 2:1 through 2027. Custom silicon takes share at the margin but Nvidia maintains 70%+ of inference workloads through CUDA lock-in and the Blackwell/Rubin generation lead. Data center revenue grows ~30% annually for three years, then decelerates to 20%. Margins hold.
Bull ($429). Sovereign AI infrastructure demand materializes at scale ($200B+ TAM materializes), inference unit economics improve faster than expected, and Nvidia successfully extends into adjacencies (CPU via Grace, networking via Mellanox, full-stack via DGX Cloud). Margins expand on operating leverage as opex stays roughly flat.
That’s a ~51% expected return from the current $208, which sounds large until you account for the time horizon (12 months to realize most of the price discovery) and the probability of the bear case actually playing out (24% is meaningful, this is not a high-conviction call).
Consensus, for what it’s worth, is in roughly the same neighborhood: 42 Buys, 4 Holds, 1 Sell among 47 analysts, with a mean price target of $309.72. I’m directionally aligned with the Street here. Where I differ is in the shape of the distribution, not the central tendency.
Where I differ from consensus
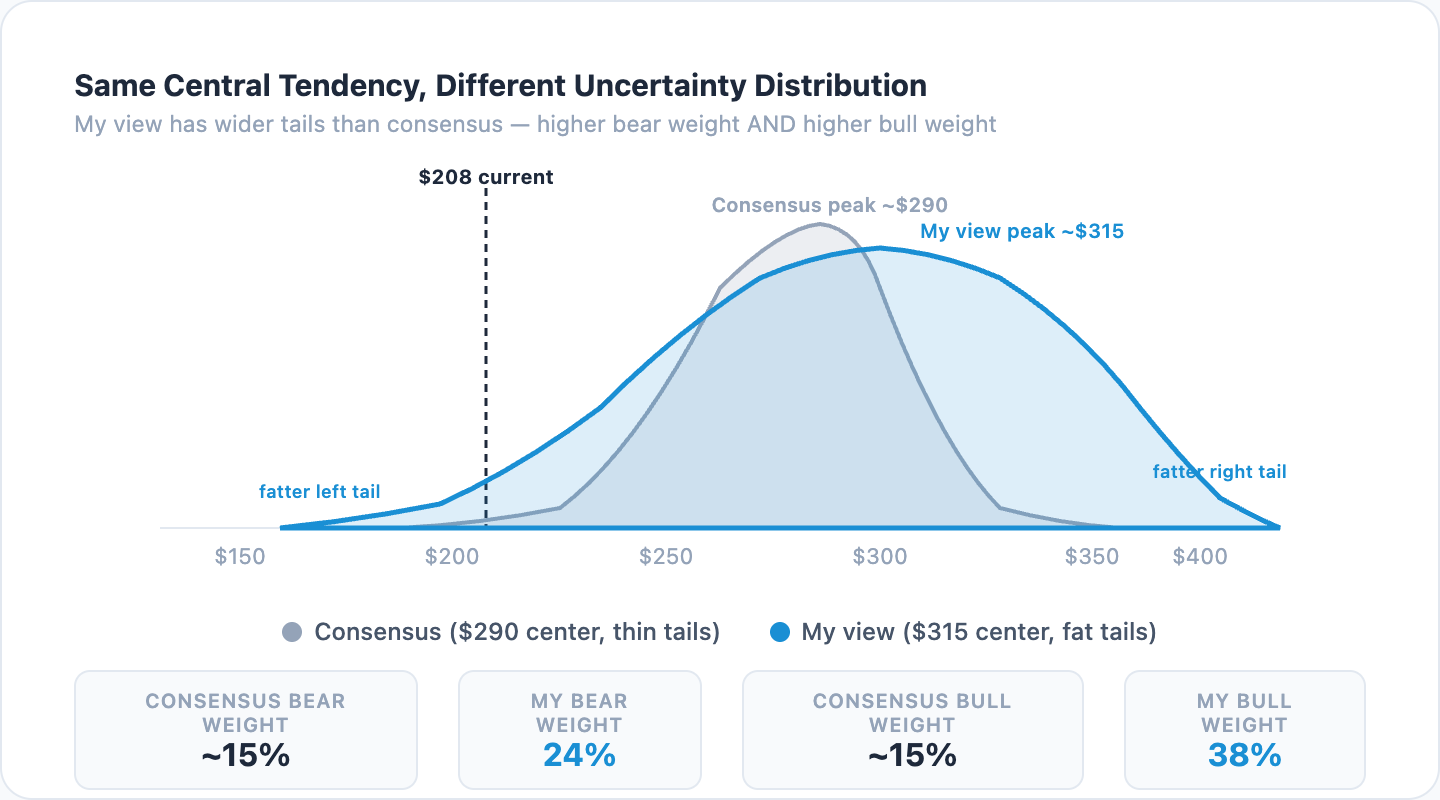
The Street’s collective view, when you decompose it, looks more like $290 with a 70% probability and Bear/Bull tails of 15% each. Mine has wider tails, 24% bear weight and 38% bull weight, for two specific reasons.
The bear weight is higher than consensus because custom silicon is moving faster than the Street acknowledges. Google’s TPU now accounts for a non-trivial share of Google’s own inference (the 10-K explicitly flags this), Amazon Trainium has gone from press release to production, and Meta’s MTIA is moving from rumor to deployment. None of these displace Nvidia in training, where the moat is real. All of them displace Nvidia in inference, which is the larger workload going forward as deployed models outnumber training runs.
If you assume custom silicon goes from ~10% of inference workloads today to 25%+ by 2028, that’s a $30–60 billion annual revenue impact at current run-rates. Consensus seems to anchor on the lower end of this range; I think the upper end is more probable than the Street prices in.
The bull weight is higher than consensus because the sovereign-AI and inference-at-scale catalysts are not in the numbers yet. Saudi Arabia’s $40B announced AI infrastructure commitment, the UAE’s similar commitment, India’s IndiaAI mission, and the EU’s stated sovereign capacity are real spending events that haven’t fully landed in consensus revenue models. The $200B CPU TAM via Grace is similarly absent from most sell-side models, analysts treat it as optionality rather than baseline.
If half of the announced sovereign AI spending materializes in Nvidia revenue over 2026–2028, that’s roughly $50–80B of incremental revenue above consensus. The bull case requires you to take that seriously.
So consensus is at $290 with thin tails; I’m at $315 with fat tails. The same central value, very different uncertainty distribution. Practical implication: if you’re a holder, the upside skew justifies holding; the downside tail justifies not letting the position run to 35%+ of a portfolio.
What the bear case actually looks like
I want to take the bear case seriously, because it is the case I am most likely to be wrong about.
The bear thesis is not “Nvidia is overvalued.” Sufficient cash flow at sufficient margins justifies almost any multiple. The bear thesis is that the rate of margin compression will exceed the rate of revenue growth, and that the operating leverage that has made Nvidia’s last three years look like a permanent change in fundamentals will reverse as customer concentration forces price concessions.
Three signals would corroborate this:
- Customer concentration moving against Nvidia. Today, the top four hyperscalers represent roughly 45% of Nvidia data center revenue. If any of them publicly disclose meaningfully higher custom silicon utilization (Google has been doing this gradually; if Microsoft or Amazon followed, the signal would harden), the multiple compresses fast.
- Pricing pressure showing up in gross margin. Current gross margins are 75%+, abnormally high for hardware. If Q3 or Q4 2026 prints come in 200–400bps lower than expected, even with revenue growth intact, that’s the leading indicator. Margins are how you see the pricing fight before it shows up in the revenue line.
- Inventory and channel signals. Hyperscalers reducing their forward inventory orders, or component suppliers (SK Hynix on HBM, TSMC on CoWoS capacity) reporting softer demand, these are the early signals of a demand inflection that would not show up in Nvidia’s own reported numbers until two quarters later.
I track all three on the live Dawo dashboard. As of the most recent data, none of them are firing. Customer concentration is stable, gross margins are intact (Q2 2026 print was actually 50bps better than expected), and HBM/CoWoS demand is well above last year. The bear case is plausible; it is not currently materializing in the data.
The bear case I am least worried about is the one most retail commentary fixates on: “another Cisco moment.” Nvidia’s position is materially different from Cisco’s in 2000. Cisco’s customers were enterprises buying routers for finite use cases. Nvidia’s customers are buying compute for a use case (AI inference) that scales with the number of model invocations, which is growing exponentially. Cisco’s gross margins were 65%; Nvidia’s are 75%+. Cisco had 50+ credible competitors; Nvidia has 3–5. The shape of the demand curve and the shape of the competitive landscape are both different. The Cisco analogy is intuitive and wrong.
What the bull case looks like
The bull case is the one I think the Street under-credits.
The specific bullish thing happening is that inference is decoupling from training in customer minds. Two years ago, hyperscaler capex was almost entirely training-oriented, building bigger models. Today, the per-token cost of inference is the bottleneck for every deployed application, and inference workloads scale with application usage, not with model size. This is a structural change. Training capex eventually flattens (you can’t make models infinitely larger faster than you can train them); inference capex scales with the user base of every model deployed, which is approximately the internet.
If you believe deployed AI applications continue to grow (a position I find hard to argue against), inference compute grows at a rate that is uncorrelated with, and likely faster than, training compute. Nvidia’s revenue base is currently weighted toward training; it is shifting toward inference. The bull case is that this shift, combined with the fact that hyperscalers cannot vertically integrate inference fast enough, sustains revenue growth above the rate at which custom silicon takes share.
The bull case I find least compelling is the “AGI changes everything” framing. Whether or not AGI arrives in 2027 or 2032, the cash flow trajectory needed to justify $5T does not require AGI. It requires deployed AI applications to scale with the internet. That’s a more boring and more defensible bull case than the speculative one.
The variant perception worth holding
If I had to compress the analytical disagreement with consensus to a single line, it’s this:
Consensus treats Nvidia as a momentum stock with strong fundamental backing. The actual setup is a high-quality compounder at a price that requires sustained hyper-growth, subtly different.
The distinction matters because momentum investors sell on deceleration signals; quality investors hold through them. Which camp dominates the shareholder base when growth eventually moderates determines the near-term path more than any fundamental factor.
If you frame Nvidia as momentum, you’re a seller the first time growth normalizes. If you frame it as a quality compounder, you’re a holder through the normalization. My base case assumes the quality frame eventually dominates, which is why my expected value sits above the current price even though I assume substantial deceleration in the base case.
What would change my mind
I am building this view on a 12-month horizon. What would shift it:
Toward more bearish: Two consecutive quarters of gross margin contraction above 200bps without commensurate revenue acceleration. Public announcements by Microsoft or Amazon of >25% custom silicon utilization. A definitive US ruling fully closing China market access without commensurate sovereign demand pickup. Any of these moves me from $315 expected to roughly $250 expected.
Toward more bullish: Sovereign AI contract wins exceeding $50B in announced spending over the next two quarters. Successful Grace CPU revenue ramp above $5B annualized. Margin expansion above 100bps in Q3 (operating leverage signal). Any of these moves me from $315 to roughly $360.
Toward “no view”: Any combination of conflicting signals where the bear case is materializing in margins but the bull case is materializing in revenue. This is the scenario I would not have high conviction about, Nvidia becomes a value-vs-growth debate that I’d want to sit out until the signals clarify.
A note on conviction
I have high conviction about the analytical framework here and lower conviction about the point estimate. That’s the honest summary. If I had to bet, I would bet that the next 12 months produce a result somewhere between $250 and $375, but the dispersion within that range is wider than I’d usually be comfortable with. I’m holding my position because I think the asymmetric upside justifies the volatility, not because I think the point estimate is precise.
The asset to be most suspicious of in this analysis is my own bull case for sovereign AI demand. I have been writing about it for six months and the announced spending has materialized more slowly than I expected. If it doesn’t show up by Q4 2026, the bull weight needs to come down and the central estimate moves toward $280.
I’d rather be transparent about that than offer a clean number.
This is research, not personalized investment advice. I hold a position in NVDA. Past performance does not guarantee future results.
Goutam Mahapatra is the founder of Dawo, an AI research engine that runs this kind of analysis automatically across the stocks you own. He was previously Head of Marketplace at Uber Eats EMEA. Reach him at goutam@dawo.ai.
Run the live NVDA analysis
Override assumptions, change scenario weights, stress-test with your own numbers.
Open NVDA on Dawo →